Visual Human–Computer Interactions for Intelligent Vehicles and Intelligent Transportation Systems: The State of the Art and Future Directions
Authors: X Wang, X Zheng, W Chen, F-Y Wang
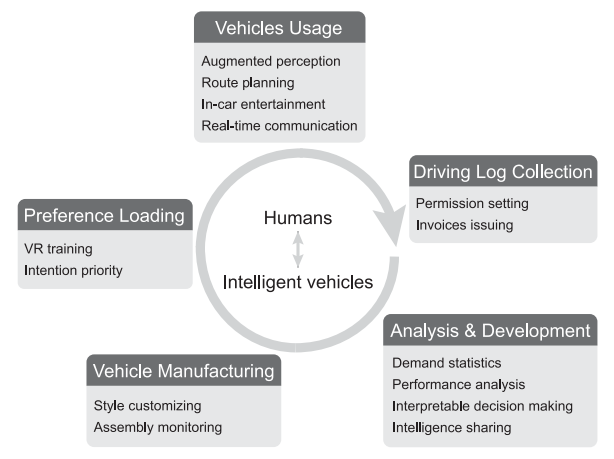
Research on intelligent vehicles has been popular in the past decade. To fill the gap between automatic approaches and man-machine control systems, it is indispensable to integrate visual human-computer interactions (VHCI) into intelligent vehicles systems. In this paper, we review existing studies on VHCI in intelligent vehicles from three aspects: visual intelligence, decision-making, and macro deployment. We discuss how VHCI evolves in intelligent vehicles and how it enhances the capability of intelligent vehicles. We present several simulated scenarios and cases for future ITS.
ConceptExplorer: Visual Analysis of Concept Drifts in Multi-source Time-series Data
Authors: X Wang, W Chen , J Xia , Z Chen , D Xu , X Wu , M Xu , T Schreck
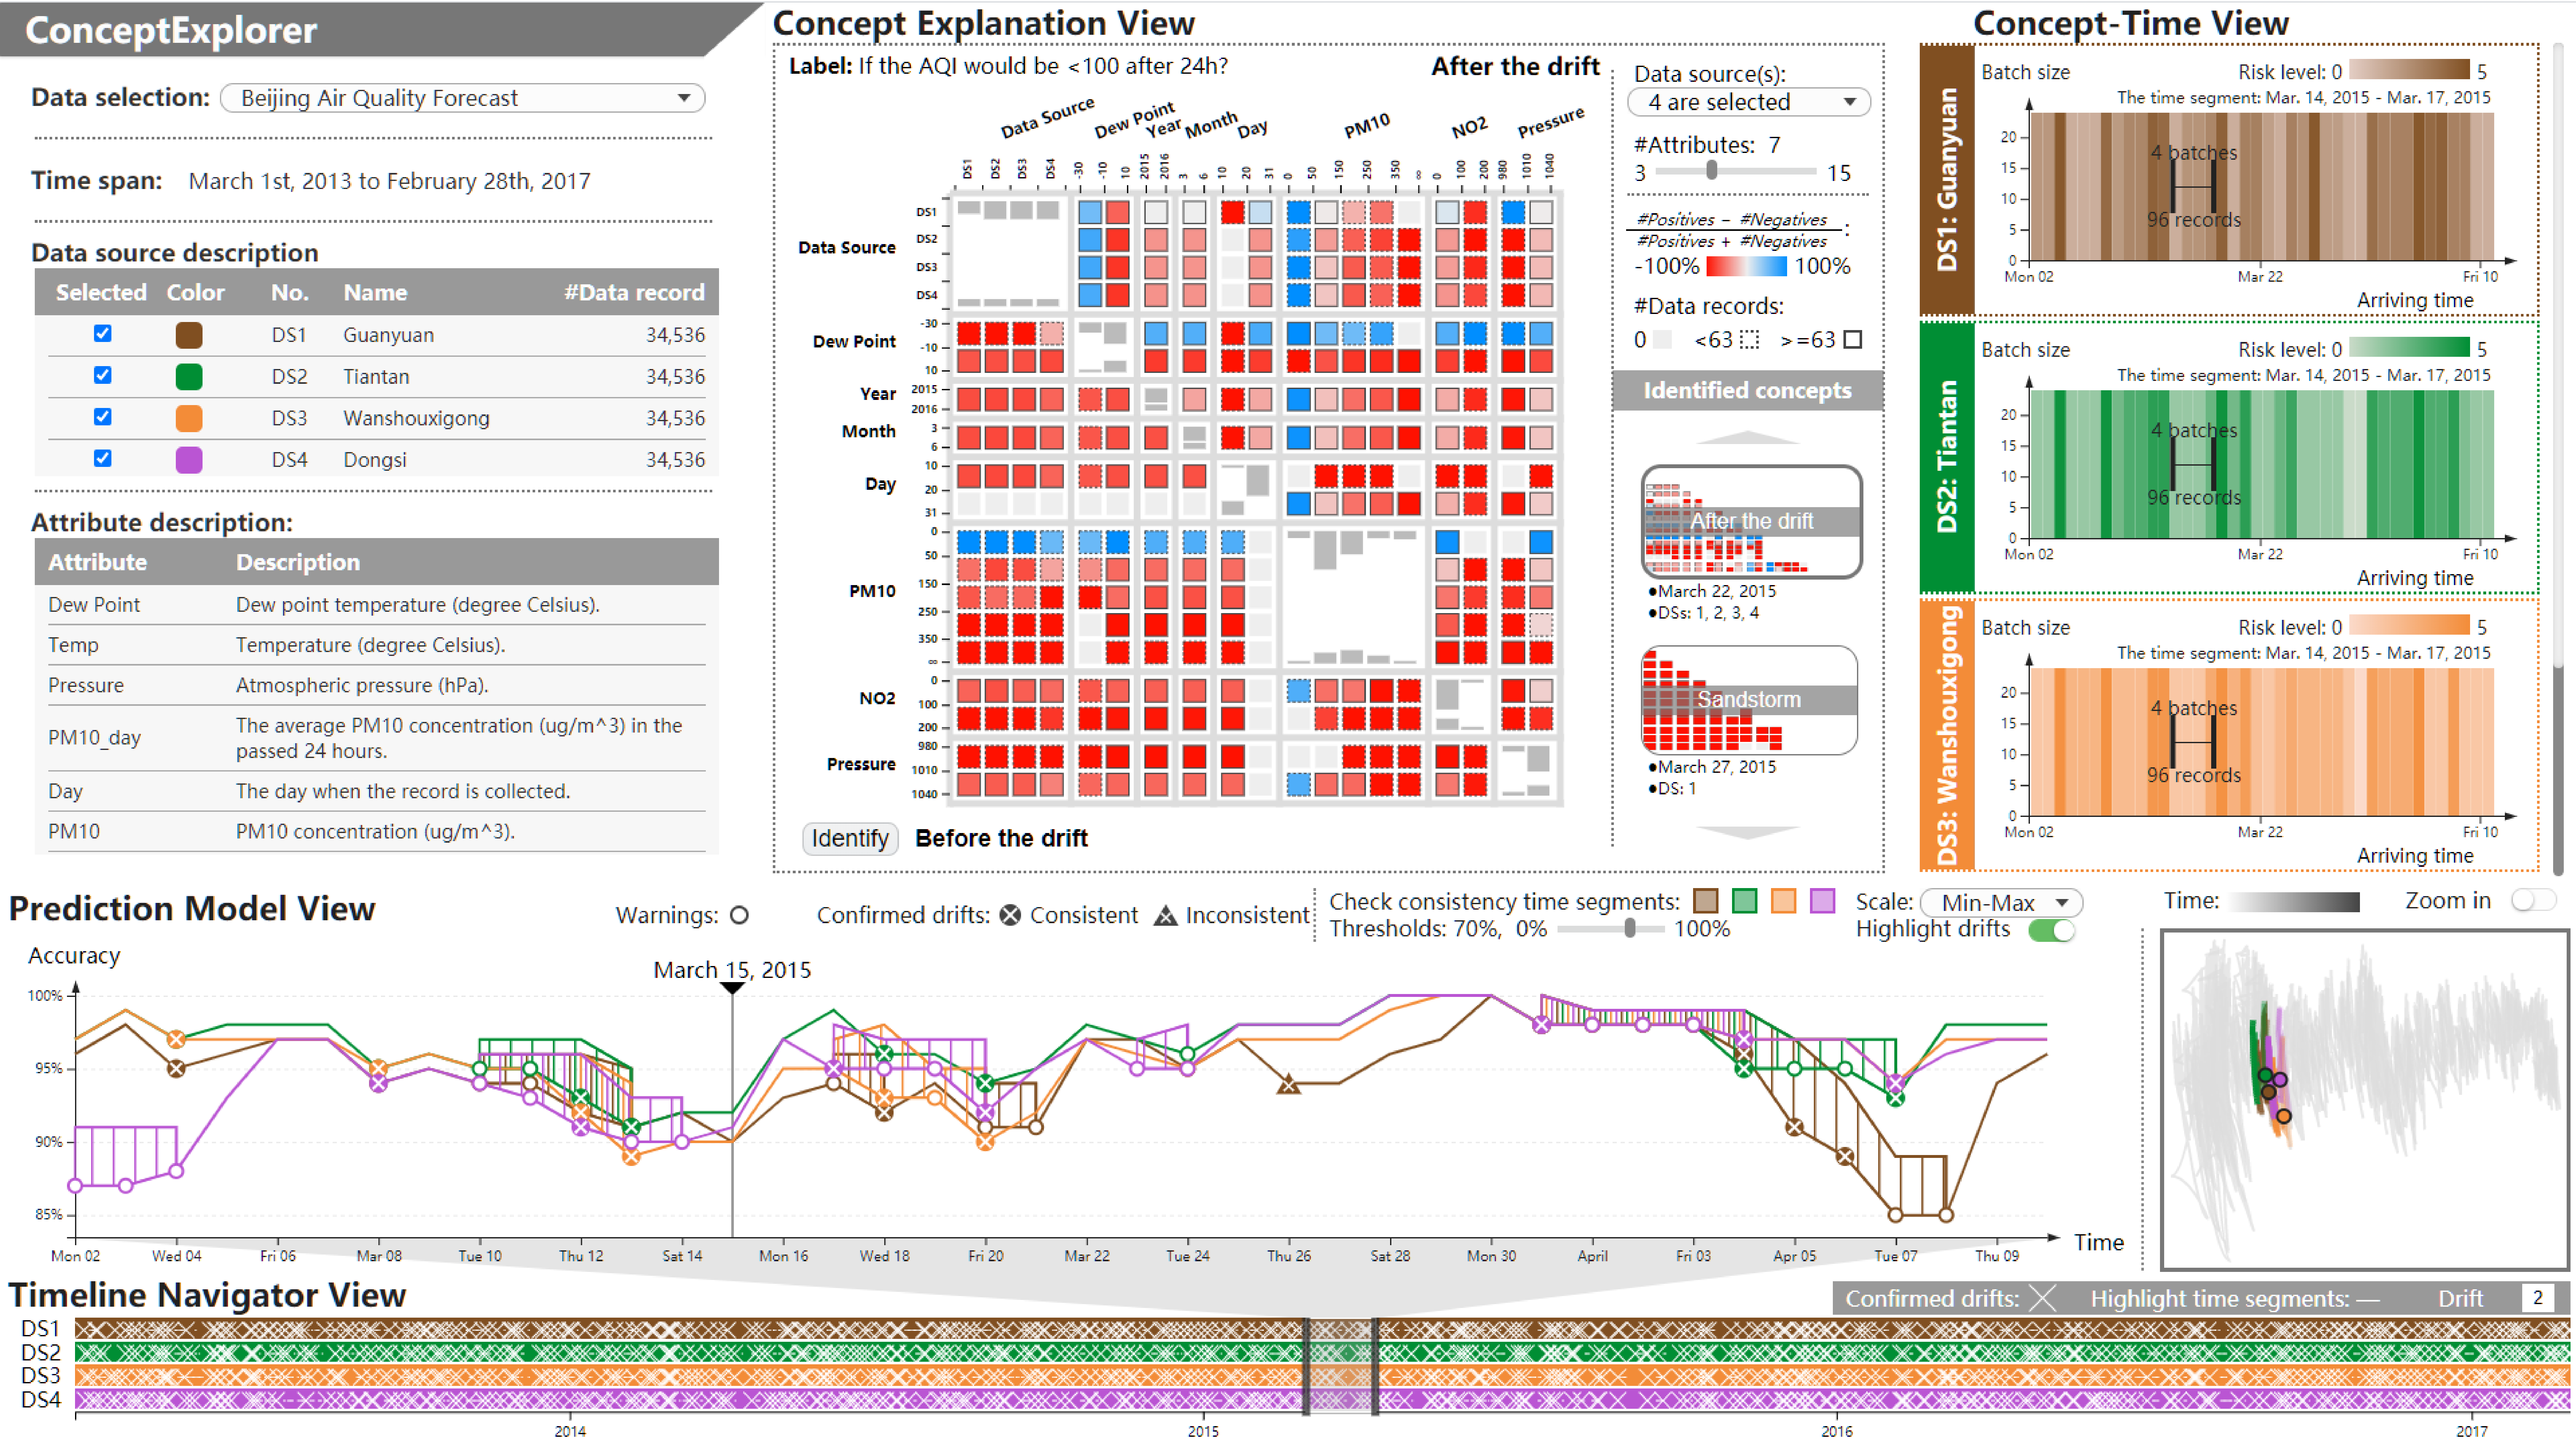
Time-series data is widely studied in various scenarios, like weather forecast, stock market, customer behavior analysis. To comprehensively learn about the dynamic environments, it is necessary to comprehend features from multiple data sources. This paper proposes a novel visual analysis approach for detecting and analyzing concept drifts from multi-sourced time-series. We propose a visual detection scheme for discovering concept drifts from multiple sourced time-series based on prediction models. We design a drift level index to depict the dynamics, and a consistency judgment model to justify whether the concept drifts from various sources are consistent. Our integrated visual interface, ConceptExplorer, facilitates visual exploration, extraction, understanding, and comparison of concepts and concept drifts from multi-source time-series data. We conduct three case studies and expert interviews to verify the effectiveness of our approach.
A User Study on the Capability of Three Geo-Based Features in Analyzing and Locating Trajectories
Authors: X Wang, T Gu, X Luo, X Cai, T Lao, W Chen, Y Wu, J Yu, W Chen
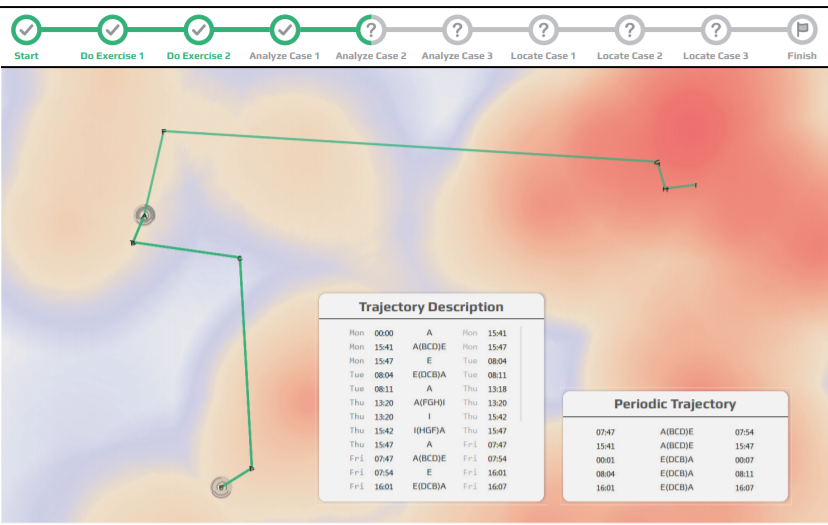
Visual analysis is widely applied to study human mobility due to the ability in integrating contextual information multiple data sources. Analyzing trajectory data through visualization improves the efficiency and accuracy of the analysis, yet may induce exposure of the location privacy. To balance the location privacy and analysis effectiveness, this work focuses on the behaviors of different geo-based contexts in the process of trajectory interpretation. Three types of geo-based contexts are identified after surveying 94 related literatures. We further conduct experiments to investigate their capability by evaluating how they benefit the analysis, and whether they lead to the location privacy exposure. Finally, we report and discuss interesting findings, and provide guidelines to the design of privacypreserving analysis approaches for human periodic trajectories.
Graphprotector: a visual interface for employing and assessing multiple privacy preserving graph algorithms
Authors: X Wang, W Chen, JK Chou, C Bryan, H Guan, W Chen, R Pan, K-L Ma
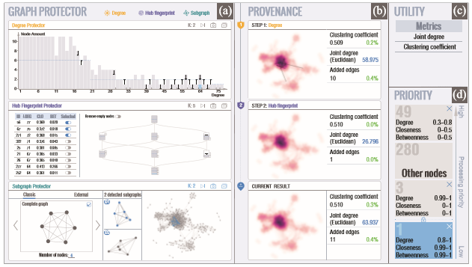
Analyzing social networks reveals the relationships between individuals and groups in the data. However, such analysis can also lead to privacy exposure (whether intentionally or inadvertently): leaking the real-world identity of ostensibly anonymous individuals. Most sanitization strategies modify the graph’s structure based on hypothesized tactics that an adversary would employ. While combining multiple anonymization schemes provides a more comprehensive privacy protection, deciding the appropriate set of techniques-along with evaluating how applying the strategies will affect the utility of the anonymized results-remains a significant challenge. To address this problem, we introduce GraphProtector, a visual interface that guides a user through a privacy preservation pipeline. GraphProtector enables multiple privacy protection schemes which can be simultaneously combined together as a hybrid approach. To demonstrate the effectiveness of GraphPro tector, we report several case studies and feedback collected from interviews with expert users in various scenarios.
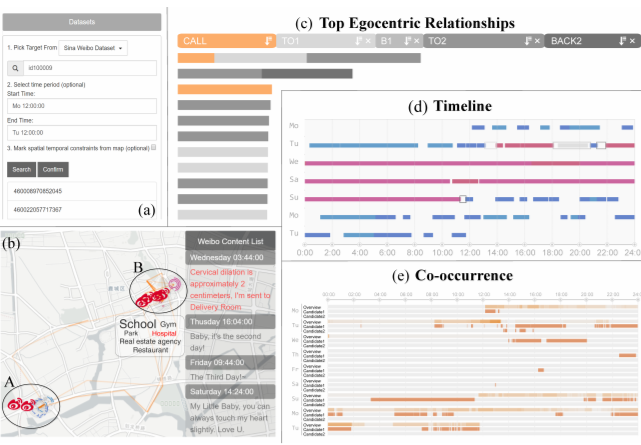
Relationlines: Visual Reasoning of Egocentric Relations from Heterogeneous Urban Data
Authors: W Chen, J Xia, X Wang, Y Wang, J Chen, L Chang
The increased accessibility of urban sensor data and the popularity of social network applications is enabling the discovery of crowd mobility and personal communication patterns. However, studying the egocentric relationships of an individual (i.e., the egocentric relations) can be very challenging because available data may refer to direct contacts, such as phone calls between individuals, or indirect contacts, such as paired location presence. In this paper, we develop methods to integrate three facets extracted from heterogeneous urban data (timelines, calls and locations) through a progressive visual reasoning and inspection scheme. Our approach uses a detect-and-filter scheme, such that, prior to visual refinement and analysis, a coarse detection is performed to extract the target individual and construct the timeline of the target. It then detects spatio-temporal co-occurrences or call-based contacts to develop the egocentric network of the individual. The filtering stage is enhanced with a line-based visual reasoning interface that facilitates flexible and comprehensive investigation of egocentric relationships and connections in terms of time, space and social networks. The integrated system, RelationLines, is demonstrated using a dataset that contains taxi GPS data, cell-base mobility data, mobile calling data, microblog data and POI data of a city with millions of citizens. We examine the effectiveness and efficiency of our system by three case studies and user review.
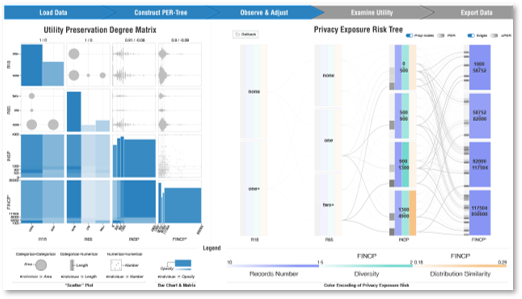
A Utility-aware Visual Approach for Anonymizing Multi-attribute Tabular Data
Authors: X Wang, JK Chou, W Chen, H Guan, W Chen, T Lao, K-L Ma
Sharing data for public usage requires sanitization to prevent sensitive information from leaking. Previous studies have presented methods for creating privacy preserving visualizations. However, few of them provide sufcient feedback to users on how much utility is reduced (or preserved) during such a process. To address this, we design a visual interface along with a data manipulation pipeline that allows users to gauge utility loss while interactively and iteratively handling privacy issues in their data. Widely known and discussed types of privacy models, i.e., syntactic anonymity and differential privacy, are integrated and compared under different use case scenarios. Case study results on a variety of examples demonstrate the effectiveness of our approach.
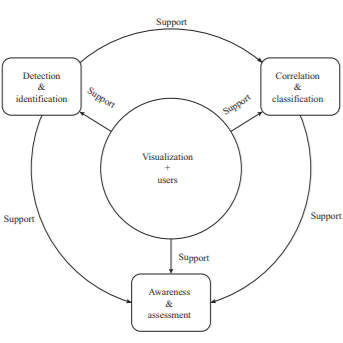
A Survey of Network Anomaly Visualization
Authors: T Zhang, X Wang, Z Li, F Guo, Y Ma, and W Chen
Visual analytics has been widely studied in the past decade. One key to make visual analytics practical for both research and industrial applications is the appropriate de nition and implementation of the visual analytics pipeline which provides effective abstractions for designing and implementing visual analytics systems. In this paper we review the previous work on visual analytics pipelines and individual modules from multiple perspectives: data, visualization, model and knowledge. In each module we discuss various representations and descriptions of pipelines inside the module, and compare the commonality and difference among them.
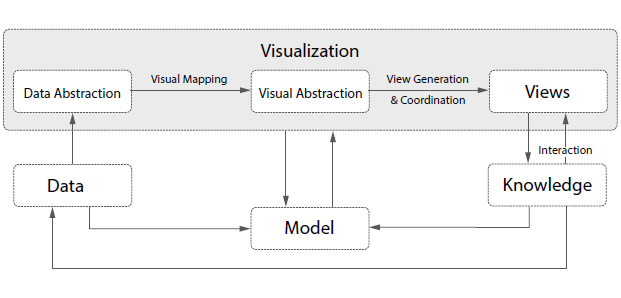
A Survey of Visual Analytic Pipeline
Authors: Xu-Meng Wang, Tian-Ye Zhang, Yu-Xin Ma, Jing Xia, and Wei Chen
Visual analytics has been widely studied in the past decade. One key to make visual analytics practical for both research and industrial applications is the appropriate de nition and implementation of the visual analytics pipeline which provides effective abstractions for designing and implementing visual analytics systems. In this paper we review the previous work on visual analytics pipelines and individual modules from multiple perspectives: data, visualization, model and knowledge. In each module we discuss various representations and descriptions of pipelines inside the module, and compare the commonality and difference among them.